Electroencephalography
The electroencephalogram (EEG) is the most common technique of Neuroimaging. It permits to record the brain activity in milli-second precision with electrodes placed on the head. With 64 or 128 channels, we can estimate the localization of the source of this activity.
The BIS plateform are notably specialized in analyses of Evoked Related Potentials(ERPs), a method using a step-wise procedure that permits the time-wise, multivariate statistical assessment of (1) the dynamic changes of scalp-recorded electric field topography indexing modulations of the configuration of intracranial generators with training, (2) global electric field power indexing modulation of response strength of the intracranial generators, (3) intracranial distributed linear electrical source estimations. These analyses provide statistically-based neurophysiological interpretability of scalp-recorded ERPs. Specifically, these ERP analyses methods utilize the data from all channels, thereby avoiding a major source of experimenter bias. In addition to statistically identifying the timing of response modulations (as in standard waveform analysis procedures), these methods differentiate effects due to (a) strength modulations of statistically indistinguishable generator configurations, (b) latency shifts across conditions, (c) topographic differences (and therefore changes in the active brain sources), or (d) any combination of these neurophysiologic phenomena, since these analyses are independent of each other. In parallel, we have expertise in methods for the solution of the so-called inverse problem, which in the case of ERPs refers to the estimation of the activity of intracranial sources based on scalp-recorded data. These methods allow us not only to estimate brain activity for each voxel of our solution space for each moment of time, but also to perform statistical analyses with these estimations across experimental conditions. The principal advantage of electrophysiological techniques is their capacity to address when during a task different mental processes are engaged, and by extension in what sequence(s) different configurations of active areas are involved. Such information is critical for addressing issues of sequential versus parallel activity, feedback vs. feedforward processing, etc.
An example of Evoked Related Potential (ERP) and topographic segmentation on electode Fz
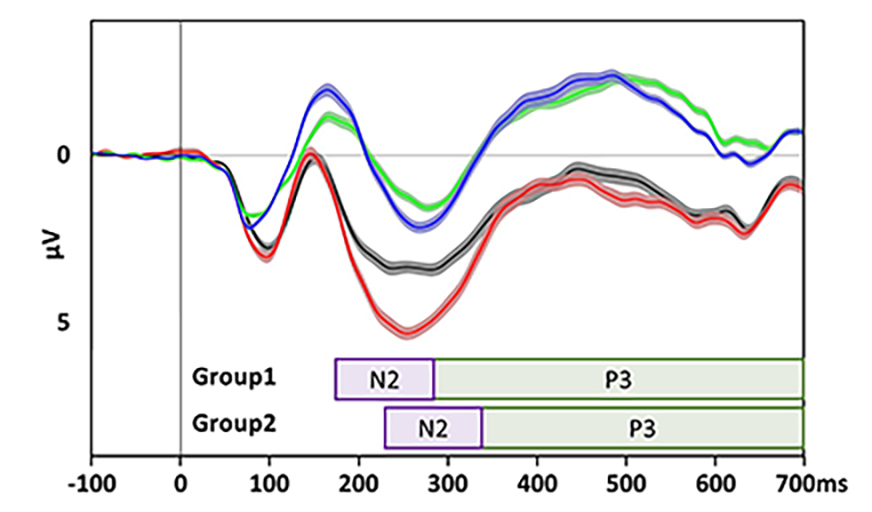
Stimulus-locked group-averaged ERP waveforms. N2 is the negative peak around 200-300 ms after stimulus onset and P3 the postivie peak around 300-500 ms after stimulus.
Black curve = Group1 condition 1
Red curve = Group 1 condition 2
Green curve = Group 2 condition 1
Blue curve = Group 2 condition 2
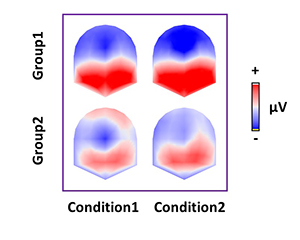
Averaged brain topography on the N2 period.
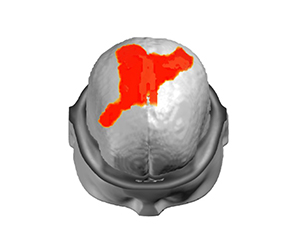
Estimation of the source activity in the brain during the N2 period.